

To measure employee well being, combine three data layers: an annual census survey for depth, short monthly or quarterly pulse surveys for trend, and automatic operational data such as absence, overtime and turnover for context. Read together, they tell you whether people are coping, where the pressure sits, and whether the last change you made helped. On a small team you can do this in a spreadsheet; the method matters far more than the tooling.
This guide walks through the whole process, including the parts most guides skip: how to pick a validated instrument, how to keep small teams anonymous, what a score actually means, and what to do on Monday after the results land.
Two words of caution before you start. First, well-being is not engagement. A team can be deeply engaged in work it finds meaningless, or loyal to a company it resents. Second, every instrument named here is a screening and research tool, not a clinical assessment. If a result suggests someone needs care, the response is a conversation and a referral to professional support, never a label.
Table of Contents
- What You Need
- Step-by-Step: How to Measure Employee Well Being
- Common Mistakes
- Frequently Asked Questions
- How often should you survey employees?
- What is a good employee survey score?
- How do you measure employee wellbeing without surveys?
- How do we report well-being data for teams smaller than five people?
- Can engagement scores be used as a well-being measure?
- What response rate do you need for reliable results?
What You Need
Most measurement efforts fail in the setup, not the survey. Before anyone fills in a single question, settle six things.
Purpose. Write one sentence describing what a result will change. If nobody can name a decision that the data would alter, the survey is theatre. “We will use this to decide which two teams get workload support this quarter” is a purpose. “We want to know how people feel” is not.
Scope. Decide who is in the population. All employees, one department, frontline staff only, contractors? Full-population census or a sample? Full-population is simpler to explain and usually worth it for a first round.
Privacy safeguards. Set the minimum group size before you know which groups you will want to report. Ten is a comfortable floor, five is the practical minimum, and anything below that should be suppressed or rolled up. Decide now whether an external partner administers the survey, because that decision is much harder to make after employees have read your internal privacy statement and found it thin.
Method mix. Decide which layers you will run: a validated survey, a pulse, operational data from your HR system, and some qualitative conversations. A mix beats any single instrument, because each one misses what the others catch.
Timing. Pick the months. Surveys launched in the week of a quarterly close will produce a response biased toward people with quiet desks.
Stakeholders. Name an executive sponsor who will read the results, an HR owner who will run the analysis, and managers who will receive the summaries. If the sponsor drops out between kickoff and results, the whole thing quietly dies.
Step-by-Step: How to Measure Employee Well Being
Six steps, in order. Skipping the middle ones is why the last one rarely happens.
Define the Well-Being Outcomes You Want to Track
Start by turning a vague goal into three to five dimensions you can actually score. A workable set usually spans psychological safety, workload and burnout, physical environment and health, belonging and social connection, and work-life balance.
Attach a decision to each one. Psychological safety maps to manager training and team norms. Burnout maps to workload redistribution and meeting load. Physical environment maps to facilities and equipment. Belonging maps to hiring, promotion and inclusion practices. Balance maps to flexibility policy and on-call rotation.
Write those decisions down before you collect anything. A measure with no decision attached is a report nobody reads, and a report nobody reads teaches employees that surveys are noise.
Choose a Validated Measurement Approach
Use an instrument that has already been tested for reliability and validity whenever you can. Inventing five Likert items in a meeting gives you a number you cannot compare to anything, including your own result next year.
These are the instruments most often cited for workplace well-being, with the domain each one covers:
| Instrument | Domain measured | Items | Scoring | Best use |
|---|---|---|---|---|
| Life Evaluation Index (Cantril ladder, used by Gallup) | Overall life evaluation | Two items: present life and expected future life, each 0 to 10 | Thriving when present is 7 or above and future is 8 or above; suffering when both are 4 or below | Population-level trend and benchmarking |
| Employee Well-Being Index (Mayo Clinic) | Fatigue, depression, burnout, anxiety and stress, social connection | Short battery, typically under two minutes | Normal, mild, moderate or moderate-to-severe symptom range per item | Quick screening with an action referral pathway |
| NIOSH Well-Being Questionnaire (WellBQ) | Work evaluation, workplace policies, workplace support, health | Five-question screener plus 26-item expanded form | Favorability by item and overall; expanded form gives four domain scores | Public-facing and research-grade reporting |
| Copenhagen Psychosocial Questionnaire (COPSOQ III) | Psychosocial work environment | Modular; commonly the 35-item short version | Domain means on a 0 to 100 scale | Comparing psychosocial risk across teams |
| OECD self-report well-being measures | Trust, workplace quality of life, burnout risk | Short battery from the OECD survey of employee well-being | Percentage favorable or favorable or neutral combined | Cross-national comparison and benchmarking |
| eNPS | Likelihood to recommend the workplace as a place to work | One item plus an open-text follow-up | Promoters minus detractors, from minus 100 to plus 100 | Trend tracking, not a well-being measure on its own |
For quantitative data, run a validated survey on a fixed schedule plus operational data you already collect: absence rate, turnover, overtime hours, internal moves, and benefits or employee assistance program utilization. For qualitative depth, add focus groups and one-on-one conversations. A 45-minute session with six to eight employees in a team will explain a 40% favorability score far faster than any dashboard.
Treat engagement tools such as the Gallup Q12 as a separate track. They measure relationship to the job. Running only engagement tells you what people feel about work, not how they are doing.
Establish Privacy, Consent, and Participation Rules
Anonymity is the whole trust mechanism, and it only works if the rules hold under pressure. Four commitments do most of the work.
- Minimum group size. Never publish results for fewer than five people, and prefer ten. Below ten, roll the group up or suppress the cell entirely, and say that you did so rather than leaving a blank on the dashboard.
- No individual attribution. State in plain language that results are never linked to performance reviews, compensation decisions or manager conversations about who said what. If free text is collected, strip identifying details before anyone reads it.
- Honest timing. Tell employees when results are published, what decision will be informed by them, and who sees the raw data. If an external partner administers the survey, name them.
- Voluntary participation. Say explicitly that people can skip questions. Forced participation produces the polite answers you already paid for in the census.
One practical addition: publish a suppression policy before the first wave. Deciding after the fact whether to show a group’s results invites accusations of cherry-picking, which damages trust more than a missing cell ever will.
Collect Baseline and Repeat Data
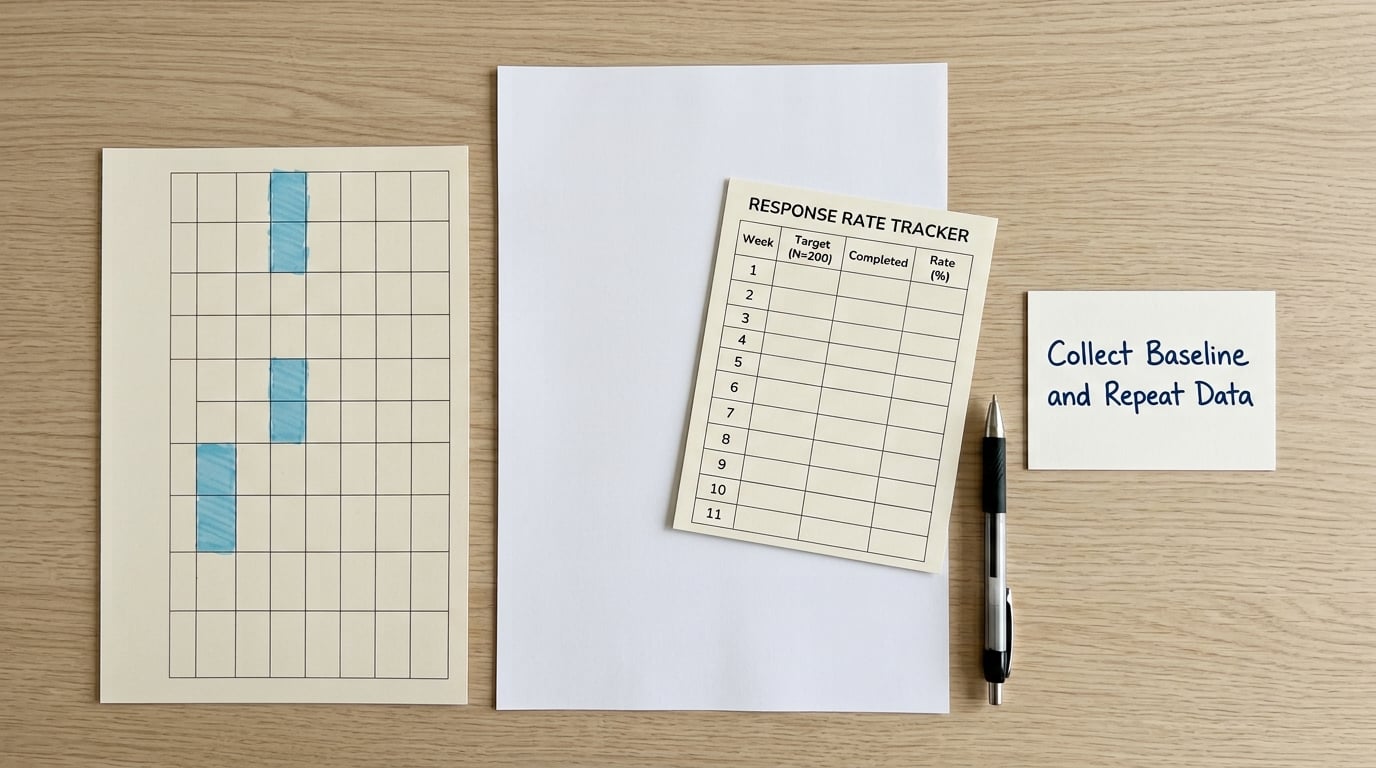
Set the cadence before the first wave so that the baseline is comparable to what follows. A workable rhythm looks like this:
- Continuous: operational data from the HR system — absence, absence duration, overtime, turnover, internal mobility, benefits use. No extra effort for employees, and it moves monthly.
- Monthly or quarterly: a pulse of 8 to 12 fixed questions, no longer than four minutes, with one open-text box. Keep wording identical every wave so trends stay readable.
- Annual: a census survey using a validated instrument, with room for open text and enough items to segment by team, tenure, role and work arrangement.
- Ad hoc: short qualitative sessions two to three times a year, and immediately after any major change such as a reorganization or a leadership handover.
Hold the pulse questions steady. Changing wording between waves destroys the trend and lets a real problem hide inside a wording change.
A pulse template you can copy today, one item per row, scored 1 to 5 unless noted:
- I know what is expected of me in my role this month.
- The workload I carry is manageable.
- I can raise a concern without it counting against me.
- My manager gives me useful feedback.
- I have the tools and information to do my job well.
- I can switch off from work when I am not working.
- My health needs are supported by how I am treated at work.
- I see a path to grow here.
- I get along with the people I work with.
- Overall, the last two weeks have been sustainable for me.
Add one open-text item: what single change would most improve your week? Read every response; the volume is usually a few hundred words, and the recurring phrase is your cheapest insight.
Set a response-rate floor and publish it. A pulse that reaches 40 to 60 percent of the population is usually workable, and anything below 25 percent tells you more about the relationship between the company and its people than it tells you about well-being. Non-response is itself a finding worth discussing, especially when it clusters in one team.
Analyze Results by Work and Workplace Context
The overall score is your starting point, not your conclusion. Read it against four filters: department, role or seniority, work arrangement (remote, hybrid, on-site), and tenure.
Two habits matter here. First, triangulate: if the burnout item falls while overtime rises, you have new information, not a contradiction. Second, respect small samples. A team of eleven with a 40 percent favorable score has a wide confidence interval, so report the number with its range and resist the story it invites.
Watch for the trap that trips up most dashboards: high engagement sitting on top of poor well-being. That combination usually means people are committed to work they cannot sustain, and it is the clearest argument for measuring the two separately.
Turn Findings Into an Action Plan
This is the step that decides whether the next wave gets answered. Keep it short and concrete.
Pick three priorities, no more. For each, write the finding in one sentence, the action in one sentence, an owner by name, a measurable objective and a date. Then publish the plan in full, including the things you decided not to do.
Set decision rules in advance so the argument is settled before the data arrives. For example: if overtime hours rise more than 10 percent quarter over quarter in a team with a below-average pulse score, the director reviews workload within 30 days. Rules written after the numbers are in are just negotiation.
Report back within a fixed window, even when progress is slow. A short note that says what moved, what did not, and what is next is what keeps the next response rate high.
Common Mistakes
Measuring and never following up. This is the most expensive mistake on the list, because it does not just waste one survey. It lowers the response rate of every survey after it. Fix: publish an action plan with the results, and a progress note on a date you set in advance.
Asking vague questions. “Are you satisfied?” invites a shrug in either direction. “How often did workload prevent you from finishing your core duties last week?” produces a usable answer. Fix: anchor each item to a specific time frame and a specific behaviour.
Relying on a single instrument. One survey carries one perspective. Fix: pair self-report with operational data and with conversations, and treat any single movement as a hypothesis to test.
Ignoring confidentiality. Reporting a team of four, or letting a manager see comments from their direct reports, ends the programme quietly. Fix: minimum group size of five, published suppression rules, third-party administration when trust is already low.
Comparing unlike groups. A change in question wording, a different scale or a different collection method produces a difference that looks like a trend. Fix: change the instrument only at a census, never mid-pulse.
Treating results as a diagnosis. A low burnout score is a prompt for support and a referral pathway, not a medical finding, and nothing about an employee should flow into a performance process. Fix: publish that rule in writing, and keep the survey data in a separate system from performance records.
Tracking everything. Thirty metrics produce no decisions. Fix: three to five dimensions, each with a named owner and a decision attached.
Two habits worth stealing from good programmes: keep the same core questions for years so your trend is real, and publish results even when they are uncomfortable. Trust follows transparency, and it does not survive a flattering summary.
Frequently Asked Questions
How often should you survey employees?
Run a validated census survey once a year, a short pulse of 8 to 12 fixed questions monthly or quarterly, and pull operational data like absence and overtime continuously. Keep pulse wording identical every wave so trends stay comparable, and cap the pulse at four minutes. More frequent than monthly rarely adds insight and reliably produces survey fatigue.
What is a good employee survey score?
There is no universal threshold, but common reference points help. On the Cantril ladder used by Gallup, a present-life rating of 7 or above with a future rating of 8 or above is classed as thriving, while ratings of 4 or below on both suggest suffering. For percent favorable items, track your own trend first and compare to published benchmarks only as context.
How do you measure employee wellbeing without surveys?
Use the operational data you already hold: absence rate and duration, turnover, overtime hours, internal mobility, and benefits or employee assistance program utilization. These show where strain is landing, not how people feel, so they work best beside a survey rather than instead of one. Add short focus groups and one-on-one conversations to explain whatever the numbers show.
How do we report well-being data for teams smaller than five people?
Do not report it at that level. Set a minimum group size of five, prefer ten, and roll smaller teams up to the next level or suppress the cell. Tell people you did this and why. A cell with three respondents identifies individuals to anyone who knows the roster, and one compromised response usually ends the whole programme.
Can engagement scores be used as a well-being measure?
Not on their own. Engagement instruments measure the relationship to the job and its goals, while well-being measures cover stress, burnout, belonging and physical and social health. Teams can score highly on engagement while feeling depleted, which is exactly the pattern a single metric hides. Measure both and read them side by side.
What response rate do you need for reliable results?
Aim for 40 to 60 percent on a short pulse and 65 percent or higher on an annual census. Below 25 percent, treat the results as indicative only and look hard at who did not answer, since non-response clusters. Say the response rate next to every result you present so nobody reads a thin sample as the truth.
If you only do one thing from this guide, do the second one: write the decision each measure will inform before you collect it. That single habit is the difference between a measurement program people answer and one they learn to ignore. Programs that start there tend to survive their first bad quarter, and the ones that start with a survey platform purchase tend not to.
Then run a baseline pulse with the ten questions above, keep the wording unchanged, and promise a written action plan within 30 days. That promise is what makes the next round of answers worth giving. If you are still deciding how to measure employee well being this quarter, make the decision-attachment step your first move.