

Analyzing injury data for trends comes down to five moves: decide what question you are answering, clean the records so they mean the same thing every time, divide by hours worked instead of counting raw reports, compare the result across time and across groups, and check whether the change is signal or noise before anyone acts on it. Most injury spreadsheets fail at step three, and that is why the same raw numbers tell four supervisors four different stories. Here is how to analyze injury data for trends without fooling yourself along the way.
The method below takes about a day for a small site and a week for a multi-site company with messy legacy records. You can do the first three steps in a spreadsheet; the later steps get easier once the data is clean.
Table of Contents
What You Need
Before you touch the numbers, line up four things. Missing any one of them is the reason most trend analyses quietly go wrong.
1. Case records with consistent fields. Every injury report needs a date, a location, a department, a job role, tenure, injury type, body part, cause, and days away or restricted. If your system cannot produce those fields, no amount of analysis will recover them.
2. An exposure denominator. Hours worked for the same period, same population, same scope as the cases. This is the piece teams skip, and skipping it makes raw counts look like risk. A department that added 40 people in May will show more injuries in May without becoming more dangerous, and only a rate separates those two facts.
3. Written definitions. What counts as an injury, what counts as a recordable case, how lost time is defined, and which near misses belong in the dataset. Without a definition held constant across the period, you are comparing two different measurements.
4. Something to compare against. Your own rolling 12-month baseline, plus external reference points such as the Bureau of Labor Statistics Incidence of Nonfatal Occupational Injuries and Illnesses figures for your industry and state, or the BLS Survey of Occupational Injuries and Illnesses establishment-level data. OSHA 300 log, 300A and 301 data give you the case definitions and the hours worked you need for an official rate.
5. Tools that match your team. A spreadsheet handles most single-site work. Excel with Power Query is the realistic upgrade when records arrive from several systems. Power BI earns its keep when several sites report on different schedules and leadership wants one view. A dedicated EHS platform matters once corrective actions and inspections start needing status tracking, not just analysis.
If an injury has already happened and someone is unsure what happens next, what to do after a workplace injury, step by step is worth reading before you build the process around it. And if your data includes chemical exposures, how to read a safety data sheet is how you confirm what substance was involved rather than guessing from the narrative field.
Step-by-Step
1. Define the Question and the Injury Scope
Write the question down before opening the file: which population, which period, which location, which job groups, and which definition of injury. “Are we getting safer” is not a question you can analyze. “Are lost-time injuries rising faster than hours worked on the night shift in Building C” is.
Fix the scope and hold it. Changing the period mid-analysis resets the baseline and makes earlier months incomparable. If you must extend the scope, restart the trend window rather than splicing two definitions together.
2. Gather and Check the Injury Data
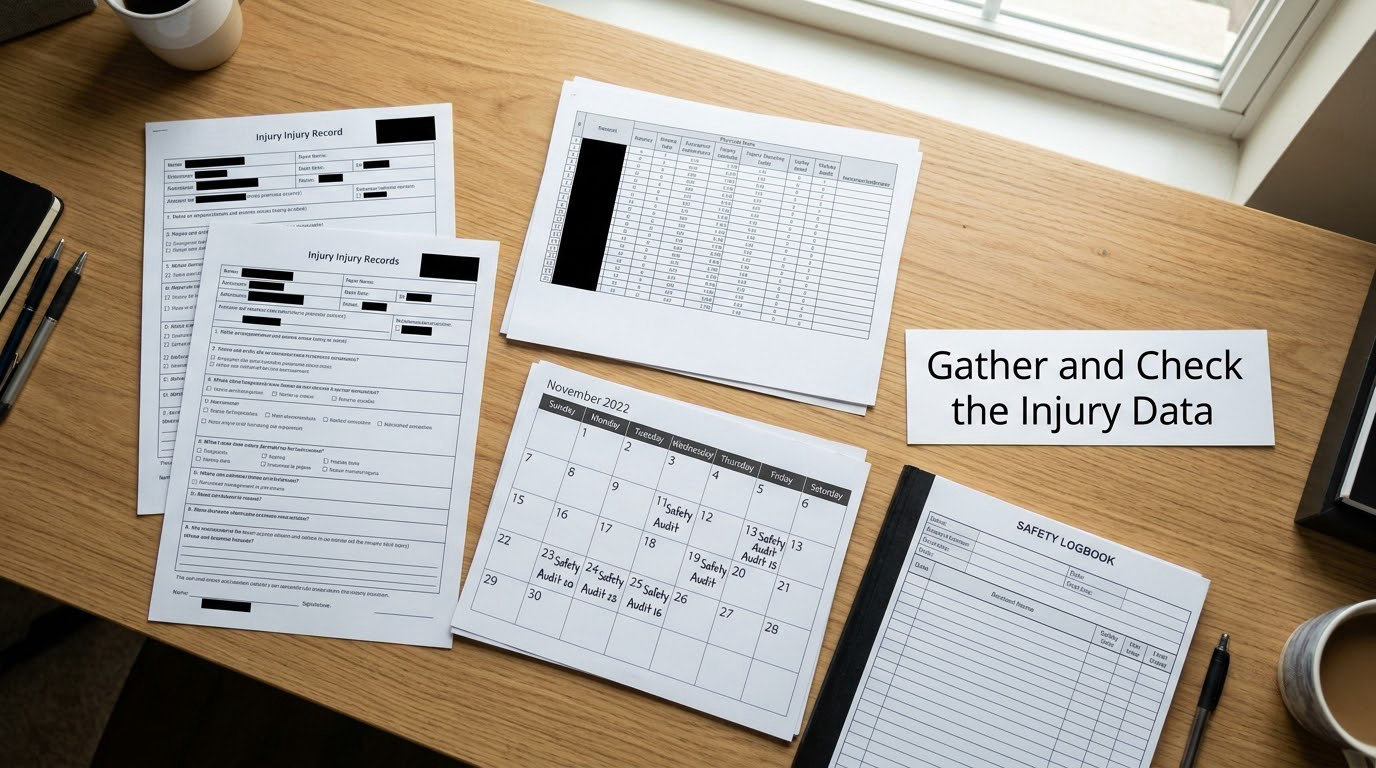
Pull case records and hours worked from the same source system and the same date range. Incidents get reported late, entered twice, or entered with a placeholder date, so check completeness before you calculate anything.
Four checks catch most problems. Confirm every case has a date and a location. Count duplicate case numbers. List cases with no hours-worked data for their month, because those months need filling before a rate can be built. Then compare total cases against your OSHA 300 log count for the same period; a mismatch means something is missing from one side.
Nothing here is theoretical. The 2026 EHS Benchmarking Report from Benchmark Gensuite, based on responses from more than 260 EHS professionals, found 45% reporting an increase in injury frequency and 39% an increase in severity, while 90% believed incidents still go unreported. Whatever number you are analyzing is a floor, not a ceiling.
3. Clean and Standardize the Records
Clean the records before you trust a single number, and keep the original file untouched beside the cleaned one so any number can be traced back to its source record.
Standardize four things. Injury type, using one taxonomy for the whole period rather than whatever words each site used. Body part, mapped to a single list. Department and location, resolved to current names even when an older record used the old site name. And severity, sorted into consistent bands such as first aid only, medical treatment, restricted duty or transfer, lost time, and fatality.
Watch for coded values that mean different things in different places. A “first aid only” case in one system may sit inside the recordable count in another. One published trade-association case, a manufacturer’s tenure analysis in Insulation Outlook, turned on exactly this kind of clean segmentation: splitting body part, injury type, and tenure showed that employees under a year of service were injured at a much higher rate, which redirected the onboarding program.
4. Calculate Rates Instead of Comparing Raw Counts
Divide by hours worked. The standard denominator for OSHA-style rates is 200,000 hours, which represents roughly 100 full-time workers working 40 hours a week for a year.
| Metric | Formula | What it tells you |
|---|---|---|
| TRIR (total recordable incident rate) | Recordable cases x 200,000 / total hours worked | How many of every 100 full-year equivalent workers had a recordable case |
| LTIFR (lost time injury frequency rate) | Lost-time cases x 200,000 / total hours worked | Frequency of lost-time events only; some companies report this per 1,000,000 hours |
| TRIFR (total recordable incident frequency rate) | Recordable plus lost-time cases x 200,000 / hours worked | Frequency including cases outside OSHA recordability, such as restricted duty |
| Incidence rate per 100 workers | Recordable cases x 100 / full-time worker equivalents | Same idea as TRIR expressed in headcount terms |
| Severity rate | Days lost x 200,000 / total hours worked | How heavy the injuries were; pair it with a frequency rate every time |
A worked example. A 240-person site recorded 12 recordable cases, 3 of them lost time, with 148 days lost, over 486,000 hours worked. TRIR is 12 x 200,000 / 486,000, which is 4.94. Full-time worker equivalents are 486,000 / 2,000, or 243, so the incidence rate per 100 workers is 12 x 100 / 243, also 4.94. The lost time frequency rate is 3 x 200,000 / 486,000, or 1.23. Severity rate is 148 x 200,000 / 486,000, or 60.9 days per 200,000 hours, and 12.3 days lost per recordable case.
The prior quarter had 5 recordable cases over 398,000 hours, a TRIR of 2.51. Counts more than doubled while hours grew by about 22%, so the rate roughly doubled too. Had a low-risk administrative team been added mid-quarter, the case count would have stayed flat while the rate fell, and the reverse story is just as easy to tell by mistake.
Report frequency and severity together. A site with a low TRIR and a rising severity rate has a different problem from one with both climbing, and each needs a different response.
5. Compare Results Over Time and Across Groups
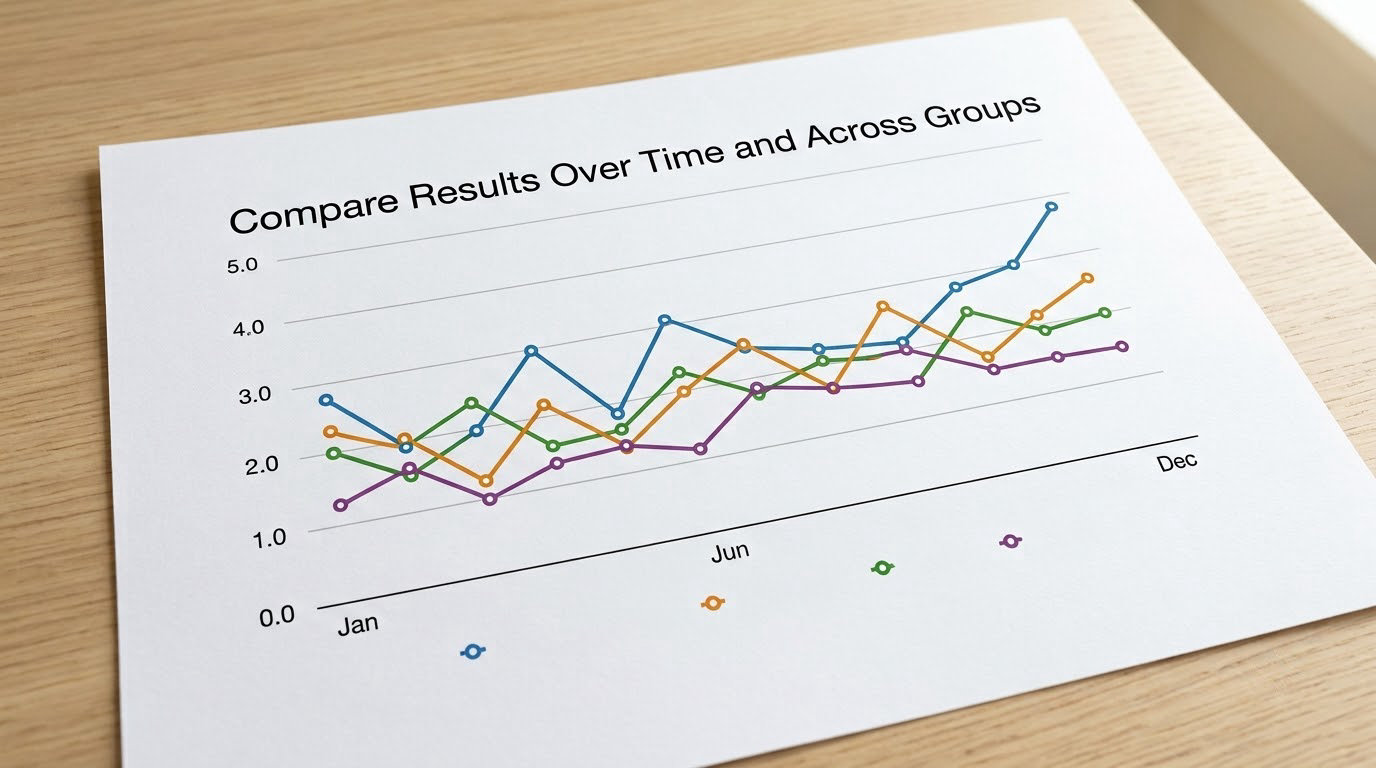
Plot the rate by month or quarter on one axis, then repeat the calculation for each segment that matters to you. Body part, injury type, department, shift, site, tenure band, and contractor versus employee are the dimensions that usually carry the explanation.
Segment one dimension at a time first, then cross two once the single cuts are clean. A monthly line for the whole company tells you something changed. A monthly line split by shift and department tells you what changed and where.
Keep the denominators small in view. A department with 4,000 hours in a month will swing wildly on almost any measure, so read its numbers as counts rather than rates until its exposure grows.
6. Test Whether Changes Are Meaningful
Small numbers move around on their own. When a period’s expected case count is in single digits, two extra injuries can double the rate with nothing real happening underneath, so treat any single month as a prompt to look, not as a finding.
Four questions settle it. Is the pattern sustained across several consecutive periods rather than one spike? Does it hold after you normalize by hours? Does it appear in more than one segment, or only one? And is it big relative to the normal variation you see in your own baseline months, which you can measure with a running mean and standard deviation over 12 to 24 months?
When the answer stays ambiguous, keep the question open. Rolling 12-month windows smooth seasonality, which matters for employers who see winter slip spikes or summer heat-related illness and would otherwise chase the same peak every year.
7. Turn the Findings Into Prevention Actions
A trend nobody acts on is a statistic. Close the loop by connecting each finding to a specific task: the inspection to run, the job-task observation to schedule, the control to install or change, the named owner, the due date, and the metric you will check afterward.
A credible action names the hazard, not the category. “Sprain strain rate up 40% in the warehouse” becomes “review pallet retrieval setup at the four highest-traffic racks, add a rotating assist at two of them, and re-measure warehouse sprain rate over the next two quarters.” Close the corrective action and record the date, because how quickly actions close is itself a leading indicator worth tracking.
Re-run the same calculation after the fix. If you changed your definition of recordable mid-year, note it on the chart so nobody reads the break as improvement.
Common Mistakes
Comparing raw counts. More people means more injuries. Fix: report rates per 200,000 hours as the default, and keep counts only for detail inside a rate you have already validated.
Mixing definitions mid-series. A changed lost-time rule or a reclassified recordable category breaks the trend line. Fix: hold definitions fixed, or split the series and mark the break on the chart.
Ignoring data quality before trusting a pattern. Missing hours-worked data, duplicate entries, and late reports all bias the denominator or the numerator. Fix: run the completeness checks in step two on every refresh, not once at the start of the year.
Overreacting to a single month. Fix: require the pattern to persist across at least three periods and to survive the rate calculation before you escalate it.
Reading only lagging indicators. Injuries fall as a workplace gets safer, which shrinks the dataset and hides hazards that are building. Fix: pair every lagging review with leading indicators such as near miss reports per 100 workers, inspection completion rate, corrective action close-out rate, and training compliance.
Two habits that make the rest easier. Keep a one-page data dictionary in the same folder as the workbook, and keep the original export next to the cleaned file so any figure can be traced back to the record behind it.
Frequently Asked Questions
What is incident trend analysis?
Incident trend analysis is the structured process of organizing recorded workplace injuries and near misses, normalizing them against hours worked, and examining how frequency, severity, location, and type change over time. Its purpose is to spot a hazard forming while it is still cheap to fix, rather than reading the numbers after somebody is already hurt.
What are the four classifications of injuries?
A common four-level ladder runs from most to least severe: fatalities, lost-time injuries, recordable cases requiring medical treatment or restricted duty or transfer, and first-aid-only cases. Organizations vary, and some add minor and near-miss events below first aid. What matters is picking one ladder, writing it down, and applying it unchanged across the whole period you are analyzing.
What are the 7 types of injuries?
A workable seven-bucket taxonomy is: strains and sprains, including overexertion and ergonomic injuries; lacerations and cuts; fractures; burns; falls, slips, and trips; chemical exposure, inhalation, or contact; and eye injuries. Different regulators and coding schemes group these differently, so use this as a starting taxonomy and map your existing codes onto it before comparing periods.
What does epidemiology of an injury mean?
Epidemiology means studying how injuries are distributed across people, place, and time, and what drives that distribution. In practice it is why you stratify by body part, task, shift, season, and tenure instead of reporting one company-wide number. It also explains the difference between frequency and severity: one counts how often injuries happen, the other weighs how costly each one was.
How many incidents do I need before a trend is meaningful?
There is no single number, and any tool claiming one is overselling. As a working rule, treat a period with fewer than about five expected cases as a count rather than a rate, and require a pattern to hold across at least three consecutive periods. Below that threshold, use a rolling 12-month window instead of monthly figures and avoid drawing conclusions from a single data point.
How often should I review injury data for trends?
Monthly for the rate refresh, because severity and investigation status change quickly, and quarterly for the deeper segmentation review by site, shift, and tenure. Keep a rolling 12-month view for decisions, since it smooths seasonal peaks. If your organization only has time for one review a quarter, do that one properly with rates, not counts, and document the definition you used.
Start tomorrow by pulling last twelve months of case records next to hours worked for the same period, and calculate one TRIR for the whole company. You will find within an hour whether the number you have been quoting all year matches the number the records support.