

An occupational health study is published research that measures health outcomes, exposures or interventions in workers, such as noise and hearing loss, silica dust and lung disease, night shift patterns and sleep problems, or a wellness programme and its effect on absence. To read one well, work through it in a fixed order: classify the design, define the question, check who was studied, see how exposure and outcome were measured, look for bias, read the effect size rather than the p-value alone, then decide whether the finding fits your workplace.
That order matters because most workplace studies are observational. Their titles and conclusions sound causal, but the design only supports association, and the gap between the two is where expensive mistakes happen. A ten-minute read in the wrong sequence leaves you accepting a headline you should have set aside.
Table of Contents
- What You Need
- Step-by-Step: How to Read an Occupational Health Study
- Step 1: Identify the Research Question
- Step 2: Check the Study Design
- Step 3: Look at Who Was Included
- Step 4: Understand the Exposure and Outcome Measures
- Step 5: Examine the Methods for Bias
- Step 6: Interpret the Numbers Correctly
- Step 7: Separate Results from the Authors’ Conclusions
- Step 8: Check Whether the Findings Fit Your Workplace
- Step 9: Read the Limitations
- Step 10: Decide What Action the Evidence Supports
- Common Mistakes
- Frequently Asked Questions
- What does a statistically significant result mean in workplace health research?
- What is the healthy worker effect?
- How do I know whether an occupational health study applies to my workplace?
- Should I trust a study funded by the company that made the product being studied?
- What is PICO and how do I use it for workplace exposures?
- What can I conclude if I can only read the abstract?
- Conclusion
What You Need
You need the study itself, not a summary of it. Press releases, vendor blogs and executive summaries drop the limitations paragraph every time, which is the part that tells you how far the finding travels.
- The full text, or at minimum the abstract, methods, results and limitations sections.
- The journal or organisation that published it, plus the date. A five-year-old exposure standard and a newer study may disagree for good reasons.
- A way to record four things as you read: the population, the exposure, the outcome, and the main conclusion in your own words.
- The funding and conflict of interest statement, which is usually in the paper footer or the acknowledgements.
- A calculator or spreadsheet for absolute risk. Relative numbers need converting before they mean anything at your scale.
If the paper sits behind a paywall, look for the accepted manuscript in a university repository, check PubMed for an abstract, or email the corresponding author. Researchers answer these requests more often than people expect, and the alternative is appraising an abstract, which cannot be done properly.
Step-by-Step: How to Read an Occupational Health Study
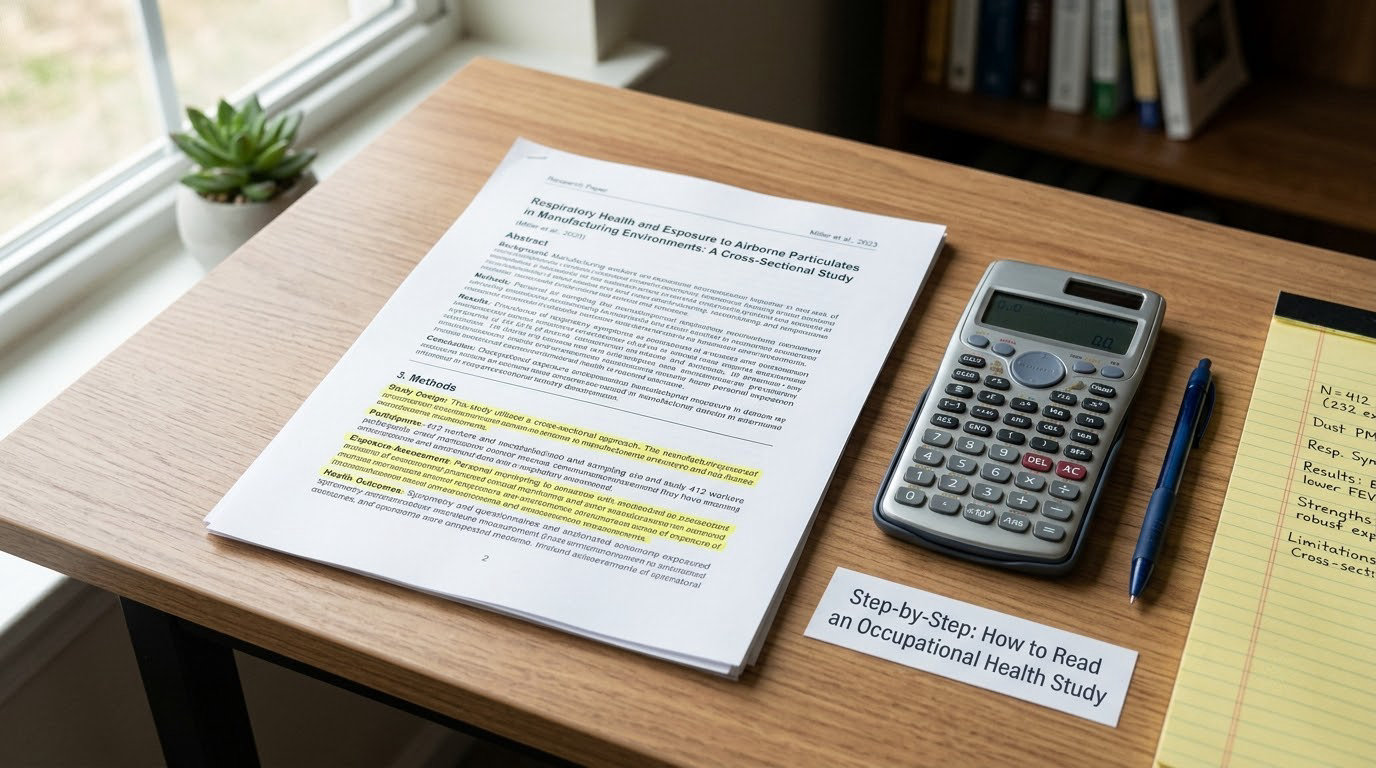
Step 1: Identify the Research Question
A study is asking about four things, and you can find all four in the abstract. Identify the population, the exposure, the outcome and the comparison group, then write the question in one sentence as: in this group of workers, compared with what, does this exposure produce this outcome.
If you cannot fill in all four slots, the paper is probably a commentary, an editorial or a description of a programme with no comparison group. Those can be useful, but you should not appraise them as if they were evidence of effect.
Step 2: Check the Study Design
The design sets the ceiling on what the study can prove, so read it before the results. A cohort study follows exposed and unexposed workers forward and can support a causal reading when exposure was measured well. A case-control study starts with people who already have the outcome and looks back at their exposure, which is efficient for rare outcomes but more exposed to recall error. A cross-sectional study measures exposure and outcome at one moment, so it reports prevalence and cannot separate cause from consequence. An intervention trial assigns a control, which is the strongest design for knowing whether something worked.
A systematic review pools several studies, which makes it valuable, but only if the search was thorough and the included studies were of reasonable quality. Six weak studies averaged together stay weak.
Identify the design from the methods section, not the title. “A cohort study of warehouse workers” and “warehouse workers and injury” can be the same study with a title that overclaims.
Step 3: Look at Who Was Included
Sample size, recruitment route and response rate tell you how much weight the finding carries. A survey with an 11 percent response rate shares its main flaw with every workplace survey you have ever received: the people who answer differ from the people who do not, and they usually differ on health.
Then check the working population itself. Look at industry, job title, employment status, shift pattern, age range, gender mix and how long people had been in the job. Studies drawn from one employer’s workforce or one professional body carry a strong prior about who those workers were.
Then think about who was left out. Contract workers, agency staff, night shift crews and people who already left for health reasons are frequently missing from workplace datasets, and those are exactly the groups with the heaviest exposures.
Step 4: Understand the Exposure and Outcome Measures
This step is where occupational health separates itself from every other kind of research paper, and where a lot of readers skip straight to the results.
Ask how exposure was measured. Direct measurement, such as air sampling, dosimetry, noise dosimetry or audiometry, is stronger than a job-exposure matrix, which assigns a typical exposure level to each job title and assumes the whole job is like the average. Self-report is weakest. Ask the same question of the outcome: a medical record or a clinical test is stronger than a self-reported symptom, and an intermediate marker such as a biomarker or a cholesterol reading is not the same as illness. Absence days are not a health outcome either, and a study that treats them as one is telling you about an administrative process.
Also check whether exposure was measured after the outcome was known, and whether the people rating exposure or symptoms knew which group a worker was in. Blinding is not always possible on a factory floor, and when it is missing, recorded judgements tend to drift toward what the researcher expected.
Step 5: Examine the Methods for Bias
Bias is a systematic push in one direction. There is no such thing as a study with none.
Look for the usual suspects. Selection bias comes from how workers were recruited or who stayed in the study. Confounding happens when a third factor travels with both the exposure and the outcome: age, smoking history, socioeconomic status, job grade, sleep, prior mental health, or long working hours. Healthy worker effect is the classic occupational version, and it works in both directions. Unhealthy workers leave, leaving a healthier workforce than the jobs actually produce, which makes a workplace look protective. Conversely, workers with symptoms leave early or reduce hours, so the effect of an exposure on the people who stopped working disappears from the analysis. That is survivor bias, and it explains why studies of the same hazard can point in opposite directions. Where stress and mental health are the exposure of interest, our guide to how to support employee mental health at work covers the measures most workplace studies draw on.
Then look at information bias, which is misclassification: a high-exposure worker recorded as low because their respirator was worn, or a low-exposure worker recorded as high. Misclassification that hits both groups equally blurs the result toward no effect. Misclassification that hits one group hard can create a spurious effect. Neither is fixable after the fact, so the appraisal question is whether the researchers discussed it and how sensitive the result is to it.
Finally, check for multiple comparisons. A paper that ran 40 subgroup analyses and reported the two that reached significance is reporting a coin flip. A dose-response pattern across several exposure bands is far more convincing than one elevated group.
Step 6: Interpret the Numbers Correctly
A relative risk of 1.4 tells you the risk was 40 percent higher in one group. It tells you nothing about whether that matters in your plant.
Convert it. If baseline risk over ten years is 4 percent and the study reports a relative risk of 1.4, the exposed risk is about 5.6 percent, so the absolute increase is roughly 1.6 cases per 100 workers and the number needed to be exposed for one additional case is about 63. A statistically solid finding can still be a trivial one.
Read the confidence interval, not just whether the value crossed the line of no effect. A relative risk of 1.4 with a confidence interval from 0.95 to 2.1 is compatible with meaningful harm and with no effect at all. A relative risk of 1.4 with a confidence interval from 1.2 to 1.6 is a much firmer claim.
Know which measure is which. A risk ratio compares risks directly. An odds ratio approximates a risk ratio only when the outcome is rare, so an odds ratio of 3.0 on a common outcome is a smaller absolute difference than it looks. A hazard ratio describes relative risk over time, and it will exceed the risk ratio when events are common. A standardised incidence ratio compares observed cases with an external reference population, which makes it useful for surveillance and weak for causal claims.
A p-value below 0.05 means the data would be this extreme or more if there were no real association. It does not mean there is a 5 percent chance the result is a fluke, which is the most common misreading in the workplace literature. A very small p-value in a huge sample can also come from a difference of one case per 10,000 workers. The p-value measures how surprising the data look under the no-effect assumption, not how much the finding matters.
Step 7: Separate Results from the Authors’ Conclusions
The results section contains what was measured. The discussion contains what the authors think it means, and the abstract’s conclusion is usually a compressed version of the discussion.
Read them in that order and keep them apart in your notes. If the results report an association between self-reported stress and self-reported absence, and the conclusion says stress causes a particular amount of productivity loss, the second claim goes past the first. Plausible overreach is normal in peer-reviewed papers, and it is worth noting which sentences are data and which are interpretation.
Step 8: Check Whether the Findings Fit Your Workplace
Compare six things: the population, the job tasks, the measured exposure levels, the industry and country, the time period, and the outcome. A study of silica exposure in quarry workers tells you something real about respirable crystalline silica and tells you much less about a machine shop where the exposure is intermittent and mostly from welding fume.
Legal jurisdiction matters too, since exposure limits and control assumptions differ between countries and change over time. So does workforce composition. A finding built on a study population that is 90 percent male in a heavy manufacturing setting transfers poorly to a site with a different shift pattern and a different age profile.
Where the fit is imperfect, treat the study as supporting the general direction of risk, not the specific number. That is usually enough to justify a control, and rarely enough to justify a specific threshold.
Step 9: Read the Limitations
Every study has limitations, and the useful question is which ones would change the estimate. A limitation about generalisability matters less to an internal decision than one about how exposure was measured.
Sort them into three buckets. Limitations that could move the effect size, such as a wide confidence interval, misclassified exposure or a 30 percent response rate. Limitations that block a causal claim, such as a cross-sectional design or uncontrolled confounding. Limitations that affect transfer, such as a single site or a narrow job category.
Notice whether the authors name their own weaknesses honestly. A study that lists confounding, residual selection bias and the impossibility of blind assessment has done better work than one claiming no limitations, because any competent occupational study has some. Conversely, an industry study that lists only sampling limitations and stays silent on funding and conflict of interest is telling you what it wants reviewed.
Step 10: Decide What Action the Evidence Supports
Turn the appraisal into a proportionate decision rather than a verdict. There are five sensible outcomes.
- Do nothing yet, because the study does not address your population or exposure.
- Watch and gather, by adding your own exposure monitoring or outcome data.
- Improve measurement, since weak exposure data is the most common reason a study cannot settle a question.
- Change a control, when the design, population and effect size line up with your site.
- Escalate, when the finding suggests a serious hazard and the evidence is strong enough that waiting is the riskier choice.
Most findings that reach a manager or an HR lead sit between the last two. The test I use: would I make this same decision if I had read only the methods and the confidence intervals? If yes, the finding is doing enough work to justify action. When the answer is yes, the evidence usually belongs in the written record rather than in someone’s inbox, and our walkthrough of how to write a workplace health and safety policy shows where it goes.
Common Mistakes
These are the errors that change decisions, roughly in the order I see them.
Reading only the abstract. The abstract is written to persuade, not to inform. It rarely says how exposure was measured, rarely reports the response rate, and never gives you a usable limitations paragraph.
Treating correlation as causation. Most workplace studies cannot separate cause from consequence because they measure everything at one moment or follow exposures that were never randomly assigned. When a study says workers with night shifts reported more sleep problems, the honest reading is that shift workers sleep worse, not that shifts are the cause until the design supports it.
Chasing the p-value and ignoring the effect. A p-value of 0.001 on a difference of 0.2 units is a real finding about precision, not about scale. Convert to absolute numbers before you mention it in a business conversation.
Ignoring the confidence interval. Wide intervals mean the study is compatible with several quite different worlds. If the interval crosses 1, or crosses the null for a measure where that matters, the honest summary is that the direction is plausible and the size is unknown.
Skipping the limitations. This is the paragraph that tells you how far the finding travels, and readers routinely treat it as an apology rather than as information.
Applying a finding from another occupation to yours. Jobs with the same label can have wildly different exposure profiles. Transferring a number across sectors without comparing tasks, levels and controls is the fastest route to a control that does nothing.
Counting a press release as a source. Headline writers convert association into cause and relative risk into alarming multiples. A useful habit is to set the summary aside, find the paper, and compare the two. If you cannot find the paper, treat the finding as unverified.
Skipping the funding statement. Industry funding does not automatically invalidate a study, and rigorous industry research exists. It does change the questions you ask: was the exposure range studied wide enough to detect harm, was the comparison group chosen sensibly, and did an independent statistician see the analysis?
Over-reading subgroup results. Subgroup analyses on small samples produce chance findings at a high rate. A subgroup difference only deserves weight if it was the pre-specified question or if it replicates elsewhere.
Assuming peer review is a guarantee. Peer review catches methodological problems that editors and reviewers notice. It does not detect a badly measured exposure, a biased recruitment route or an analysis nobody thought to question.
Frequently Asked Questions
What does a statistically significant result mean in workplace health research?
It means the observed data would be this extreme or more if there were no real association between exposure and outcome. It does not mean there is a five percent chance the result is a fluke, which is the most common misreading. Significance says nothing about size or importance, so always convert the result to absolute risk and check the confidence interval before acting on it.
What is the healthy worker effect?
It is a selection bias built into employment itself. Healthier people take and keep jobs, and workers who become unwell leave, retire or cut their hours. Both movements can make a workplace look safer or a hazard look harmless. Survivor bias, where the sickest workers drop out of follow-up, is the same problem seen over time, and it matters most in long-term cohort studies.
How do I know whether an occupational health study applies to my workplace?
Compare six things: the worker population, the job tasks, the measured exposure levels, the industry and country, the period covered, and the outcome definition. If those line up reasonably, the study can inform your decision. If they do not, use the finding as support for the general direction of risk rather than for the specific number, and gather your own monitoring data.
Should I trust a study funded by the company that made the product being studied?
Judge the study, not only the funder. Ask whether the exposure range examined was wide enough to detect harm, whether the comparison group was reasonable, whether outcomes were assessed objectively, and whether the analysis and data were made available for independent review. Industry-funded research is not automatically wrong, but the burden of proof sits with the paper rather than with you.
What is PICO and how do I use it for workplace exposures?
PICO stands for Population, Intervention, Comparison and Outcome, and it is a way to frame a question before you search. For occupational research, Intervention usually becomes Exposure, and P becomes Problem, so the question reads: in this group of workers, exposed to what, compared with what, does what outcome change. Writing it out this way tells you immediately which sections of the paper to read.
What can I conclude if I can only read the abstract?
You can classify the design and note the population, exposure and outcome. You cannot judge exposure measurement quality, bias, confidence intervals or applicability, which means you cannot support a decision on the abstract alone. Look for the accepted manuscript in a university repository, search PubMed for the title, or email the corresponding author before treating the finding as usable.
Conclusion
Start with the workplace question, not the paper. Name what you need to know, identify the study design, check who was studied and how exposure was measured, then judge the bias, the effect size and the confidence interval before you judge whether the finding fits your site. Most of the time the honest verdict is “worth acting on carefully” rather than “settled”, and a finding you can defend in a few sentences beats one you cannot.